29,775 B2B SaaS AI Buyer Prompts: Study
See what 29,775 mapped AI buyer prompts reveal about B2B SaaS shortlists, alternatives, and problem-led evaluation, with methods and aggregate data.

We mapped 29,775 B2B SaaS AI buyer prompts into three decision jobs: category shortlists, competitor alternatives, and problem-led evaluation. The map was constructed from 9,925 eligible company records to give teams a controlled starting point for prompt monitoring.
The practical conclusion is simple. Start with the prompts that can create or change a vendor shortlist, then measure whether ChatGPT, Claude, Gemini, Perplexity, Google AI Overviews, Microsoft Copilot, Grok, and Kimi name your brand. That is the core of AI visibility monitoring.
A buyer can ask an answer engine which vendors to consider before visiting a vendor website. That changes the first measurement question from only “where do we rank?” to “which buyer prompts matter, and are we included when those prompts are asked?”
For each eligible company record, the research workflow constructed:
- a category shortlist prompt
- an alternatives prompt
- a problem or evaluation prompt
This article reports the aggregate patterns in that prompt map. It does not claim that the prompts are observed search queries or that any engine currently recommends a particular vendor.
Methodology
Sonarvue used a private research workflow to assemble and normalize B2B SaaS company records. The analysis included rows that had a company name, domain, source record, and all three required prompt fields.
- Research unit: one eligible company record.
- Source universe: 9,925 company records collected across 17 retrieval batches after upstream deduplication and required-field checks.
- Prompt construction: one category, one alternatives, and one problem-led prompt per record, for 29,775 prompt archetypes in total.
- Aggregation: category labels were extracted from the category prompt; employee counts were grouped into consistent size bands; country values were counted as supplied in the normalized record.
- Collection window: all source records used in this version were retrieved on July 14, 2026.
- Publication: results are reported only as aggregate counts and percentages. No private contact data is included.
Download the aggregate B2B SaaS AI buyer prompt summary CSV. It contains the headline metrics and leading distributions used in this article, not the underlying company-level records.
Limitations
This is a constructed prompt-market map, not query-log research, a buyer survey, or a search-volume study. One prompt was deliberately assigned to each of the three classes, so the class counts do not measure relative demand. The sample also skews toward small North American B2B SaaS companies and should not be treated as a census of the software market.
The map identifies a useful monitoring surface. It does not show which answer engines name which vendors today. That requires running the prompts through each engine on a consistent cadence and evaluating the resulting answers.
Finding 1: three prompt classes cover the first monitoring pass
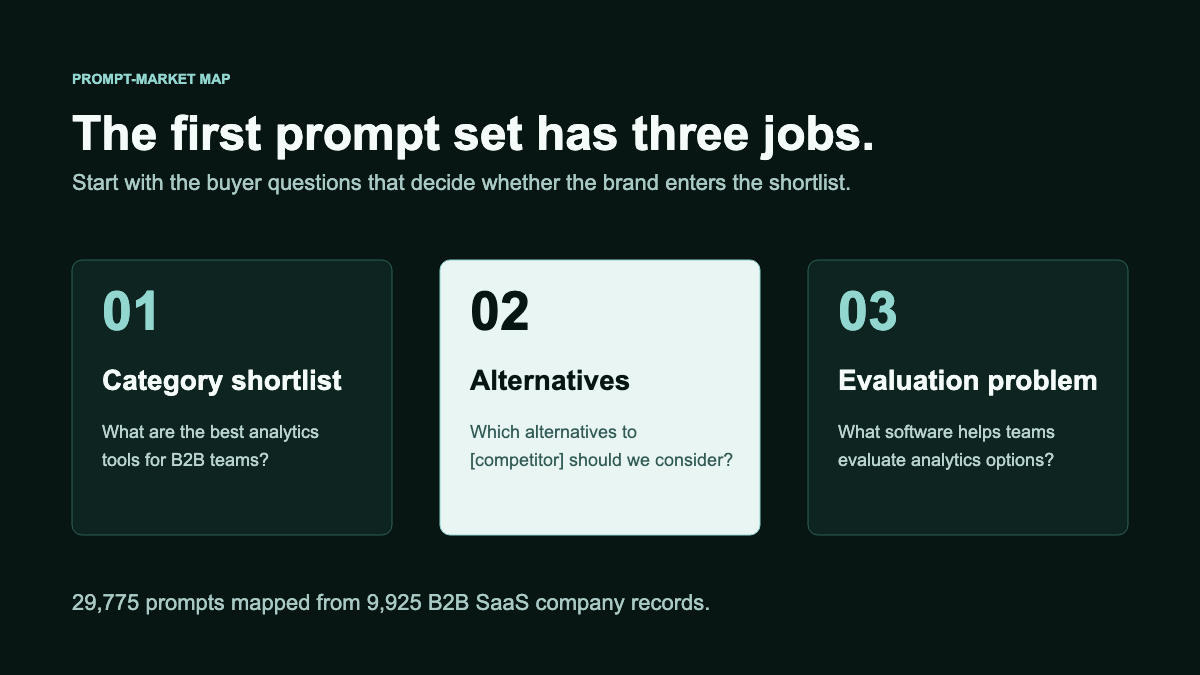
The controlled starting set has three jobs:
| Prompt class | Example | Why it matters |
|---|---|---|
| Category shortlist | ”What are the best analytics tools for B2B teams?” | This is the prompt that creates the first vendor list. |
| Alternatives | ”Which alternatives to [competitor] should B2B teams consider?” | This is where challenger brands can enter active evaluations. |
| Evaluation problem | ”What software helps B2B teams evaluate analytics options?” | This catches buyers who describe the job, not the category. |
A team does not need 500 prompts on day one. It needs a focused sample of prompts that could determine whether the brand enters the answer at all.
That is the practical starting point for AEO tracking software: category, alternatives, and problem-led evaluation measured across the same engines and intervals.
Finding 2: alternatives deserve a separate tracking lane
Every company record received an alternatives prompt by design. The strategic implication matters: once a buyer knows one incumbent, they can ask an AI to construct a replacement shortlist.
For a challenger brand, this is often the most valuable prompt class to monitor. A buyer asking “alternatives to X” has already accepted the category. They are not looking for education. They are looking for a shortlist.
For an incumbent, the same prompt is a defense problem. If the answer names three alternatives and skips you, the model is quietly teaching the market who belongs in the comparison set.
Finding 3: prompt categories cluster around a few buying jobs
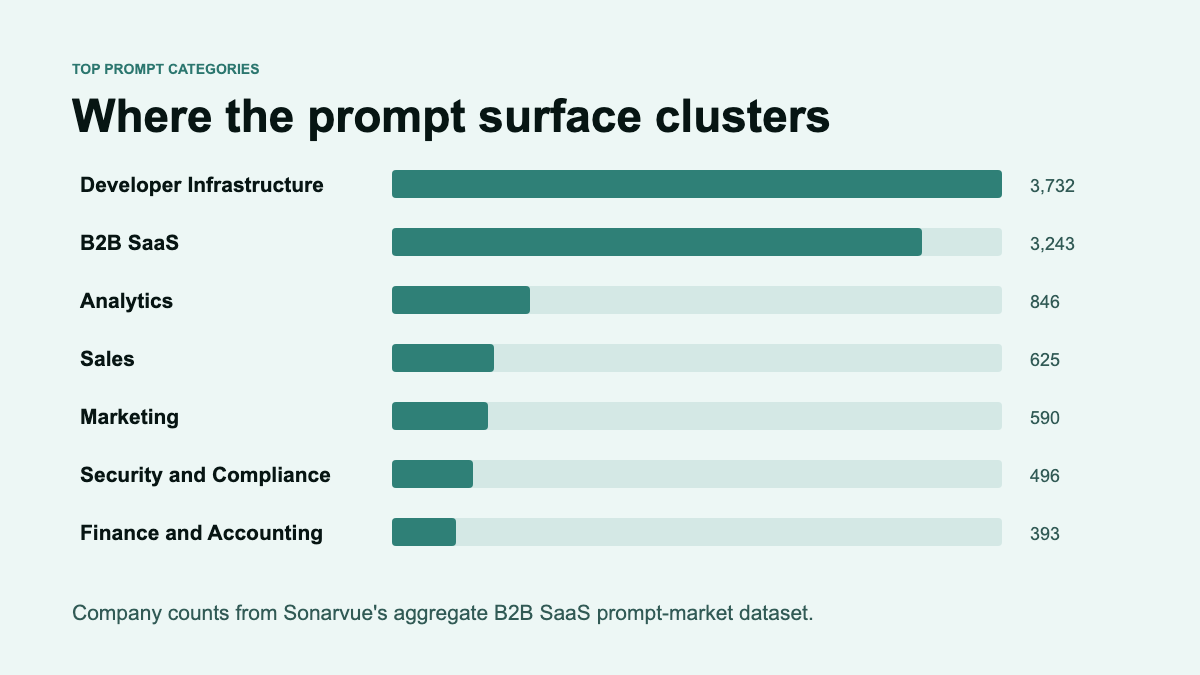
The generated category prompts were not evenly spread. They clustered around a small set of B2B software jobs.
| Prompt category | Companies | Share of sample |
|---|---|---|
| Developer Infrastructure | 3,732 | 37.6% |
| B2B SaaS | 3,243 | 32.7% |
| Analytics | 846 | 8.5% |
| Sales | 625 | 6.3% |
| Marketing | 590 | 5.9% |
| Security and Compliance | 496 | 5% |
| Finance and Accounting | 393 | 4% |
Developer infrastructure and broad B2B SaaS prompts dominated the sample. Analytics, sales, marketing, security, and finance followed.
That does not mean those categories have the most search volume. It means the account universe we analyzed produced many prompt surfaces where buyers could ask for tools, alternatives, and evaluation help. For teams in those categories, AI-answer monitoring should start with the exact buyer language around those jobs.
Finding 4: the exposed companies are mostly small teams
The sample skewed small and founder-led, which is exactly where AI-answer blind spots can hurt most. Smaller teams often do not have an analyst relations motion, a large review footprint, or a mature comparison-page program.
| Company size | Companies | Share of sample |
|---|---|---|
| 11-50 employees | 4,799 | 48.4% |
| 1-10 employees | 3,533 | 35.6% |
| 51-100 employees | 909 | 9.2% |
| 101-200 employees | 684 | 6.9% |
83.9% of the companies in the dataset had 50 or fewer employees. For those teams, AI answers can become a distribution layer before the company has built traditional category authority. The AI visibility guide for B2B SaaS turns that risk into a focused measurement workflow.
Finding 5: the geographic center was North America
The dataset was not globally balanced. It was built for a report-first outreach motion focused on English-language B2B SaaS markets.
| Country | Companies | Share of sample |
|---|---|---|
| United States | 8,068 | 81.3% |
| Canada | 1,541 | 15.5% |
| United Kingdom | 109 | 1.1% |
| Australia | 106 | 1.1% |
| Germany | 101 | 1% |
Use the numbers accordingly. The pattern is useful for B2B SaaS prompt strategy, not as a census of all SaaS companies.
What to do with this
Start with ten prompts, not a massive tracking spreadsheet.
For each priority category or product line, write:
- two category shortlist prompts
- three alternatives prompts against known competitors
- three problem-led evaluation prompts
- two pricing, implementation, or integration prompts
Then run the prompts across the engines your buyers actually use. For each answer, record:
- whether your brand is named
- where it appears
- which competitors are named instead
- which sources shape the answer
- the first page or content fix that would make the answer more likely to include you
The point is not to create another reporting dashboard. The point is to find the answers where buyers are already deciding who belongs on the shortlist.
Where Sonarvue fits
Sonarvue turns this from a one-time spreadsheet into a monitoring loop. You define the prompts, track the engines, see whether your brand is named, and get a concrete fix for each gap.
Run a free AI visibility check to grade a domain, identify the first prompt gaps, and see which competitors answer engines recommend instead.