AI Visibility Misses the Claim Layer: 2,862 Claims Audited
We audited 2,862 AI product claims and found why mention and citation metrics miss category, pricing, free-plan, and trial errors.

Marketing dashboards love one green number.
Share of voice. Citation rate. Sentiment. One screenshot for the Monday meeting. Everyone nods. With luck, the meeting even ends early.
Here is the problem: an AI answer can mention your brand, cite your homepage, and still put you in the wrong category or invent your starting price.
Most visibility dashboards count that as a win. That is understandable: mentions and citations are clean events. A buyer still experiences the wrong category or price as misinformation.
We ran this benchmark at Sonarvue because we caught ourselves making the same substitution. Mention-level metrics were clean, comparable, and easy to chart. They did not tell us whether the answer was safe for a buyer to trust.
So we asked GPT 5.5, Gemini 3 Flash, and Claude Fable 5 to describe 100 B2B software companies. Their 300 answers became 2,862 individual product claims, which we checked against 1,048 facts captured from official company pages.
The search-enabled answers reached 98.6% verified accuracy.
That sounds like the problem is solved.
Then we looked at the denominator.
Disclosure: Sonarvue conducted this benchmark using public company websites, not customer data. The public company-level dataset is anonymized.
Download the aggregate results, generation comparison, source comparison, source risk by field, anonymized company data, or public JSON summary.
AI Visibility Has a Claim Layer
Most AI visibility reporting starts with three useful questions:
- Did the answer mention the brand?
- Where did the brand appear relative to competitors?
- Which pages did the answer cite?
Those questions measure presence. Buyers act on what the answer says after the brand appears.
If an answer recommends your company, calls it an enterprise security platform, and says plans start at $49, the mention only tells you that you entered the room. The category and price determine whether the buyer keeps listening.
That creates a six-layer measurement stack:
| Layer | Question |
|---|---|
| Presence | Was the brand named? |
| Position | Where did it appear versus competitors? |
| Source | Which URL did the model report? |
| Claim | What factual statement did the model make? |
| Evidence | Does current evidence support that statement? |
| Drift | Did the claim or source change on the next run? |
Share of voice is useful at the top. It is not a debugger.
The claim layer is where a marketing metric becomes an operational system. It separates “we were invisible” from “we were visible for the wrong reason.”
You do not need to throw out the metrics you already have. Keep share of voice as the map. For the buyer prompts that matter most, open the raw answer and inspect the category, price, plan, trial, and integration claims underneath it.
HackerNoon recently covered a 21,000-citation study that separated citation frequency from actual influence. Our benchmark picks up one step later: even an influential source does not guarantee that every attached product claim is current or supported.
The Accuracy Score Was Right and Still Incomplete
GPT 5.5 and Gemini 3 Flash produced 1,999 claims in the search-enabled part of the test.
| Verdict | Claims | Share |
|---|---|---|
| Supported | 552 | 27.6% |
| Contradicted | 8 | 0.4% |
| Not verifiable | 857 | 42.9% |
| Non-claim or explicit unknown | 582 | 29.1% |
Verified accuracy uses the claims our evidence could decide:
552 supported / (552 supported + 8 contradicted) = 98.6%
The calculation is sound. It covers 560 claims.
Another 857 substantive claims sat outside that denominator. They were not errors, but they were not confirmed either. When we measured how much of the substantive answer the evidence could settle, coverage fell to 39.5%.
That gives marketing and engineering two different metrics to own:
- Verified accuracy asks whether the answer agreed when the captured evidence could judge it.
- Evidence coverage asks how much of the substantive answer the evidence could judge at all.
We treat “not verifiable” as an explicit unresolved state, not a soft failure label. The support may exist outside the bounded crawl. The official site may omit the detail. The model may have made it up. A trustworthy pipeline preserves that uncertainty instead of laundering it into a score.
For a marketer, this means the 98.6% headline cannot stand alone in a report.
For an engineer, it means not_verifiable belongs in the schema as a first-class verdict. For the person reading the report, evidence coverage should sit beside accuracy so nobody has to reverse-engineer what the score excluded.
Liu, Zhang, and Liang’s generative-search audit makes a related distinction between citation completeness and citation correctness. Does an answer cite enough claims, and does each citation support its associated sentence? Our data shows why the denominator must travel with the accuracy score.
Citations Are Telemetry, Not Ground Truth
GPT 5.5 reported a source for every one of its 775 substantive assertions. Gemini 3 Flash reported one for 641 of 642.
Great source coverage. Still not proof.
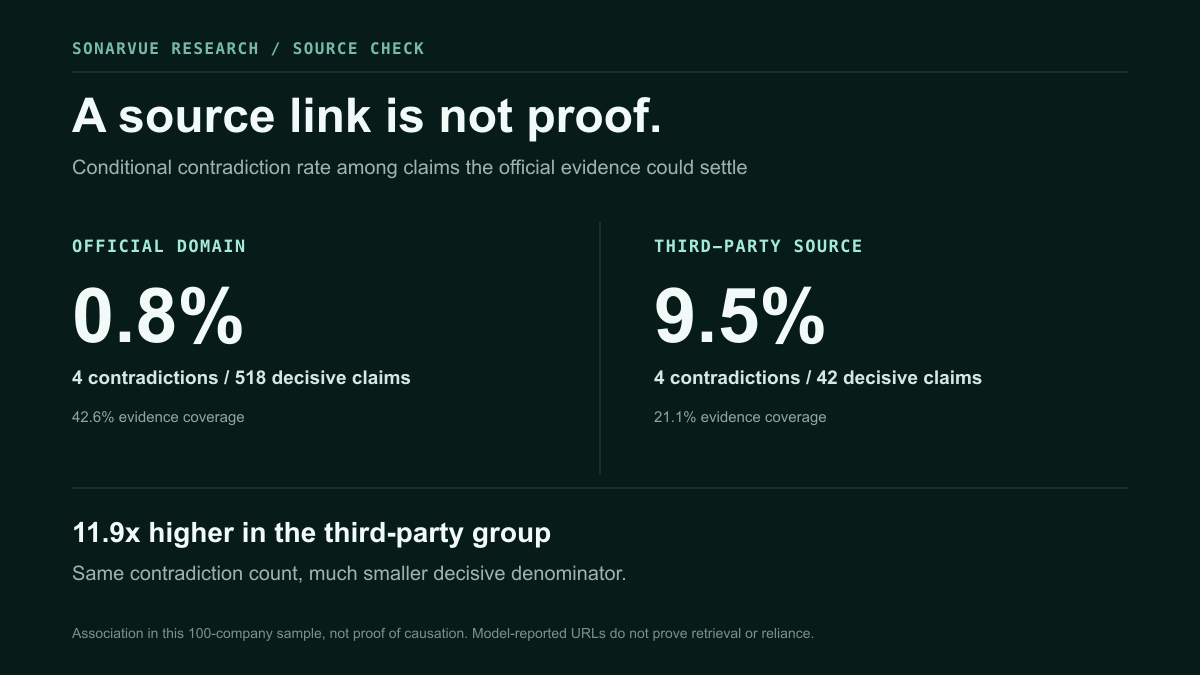
We split the claims by the type of source they reported. Official-domain claims produced 514 supported claims, four contradictions, and 699 unresolved claims. Third-party claims produced 38 supported claims, four contradictions, and 157 unresolved claims.
Among claims the evidence could settle, the contradiction rate was 0.8% for official-domain claims and 9.5% for third-party claims. That is roughly a 12x difference.
The full sentence is: third-party claims showed a roughly 12x higher conditional contradiction rate, based on four contradictions in each source group. The multiplier is the signal. The counts tell you how cautiously to use it.
The coverage difference was less fragile. Official-domain claims had 42.6% evidence coverage, compared with 21.1% for third-party claims.
There is another technical catch. “Reported source” means the URL appeared in the answer. We did not have browser telemetry proving the model opened that page, read it, and relied on it for the adjacent sentence.
A citation is useful telemetry. It is not a notarized affidavit.
Allaham and Diakopoulos found AI-generated pages appearing among generative-search citations. A separate study of 167,551 citations found that 85.7% of sources used for brand-reputation questions were third party. Our named-company product prompt leaned much more heavily toward official domains.
Different prompts produce different source markets. Any dashboard that hides the prompt while ranking domains is hiding half the experiment.
The Misses Hit Buyer-Deciding Facts
The eight confirmed contradictions were not spectacular. Nobody claimed a CRM could launch a satellite.
They were more dangerous than that. They were believable.
Three answers confused the company itself:
- Gemini described Revelation Software as an online qualitative-research platform. The company makes OpenInsight, a NoSQL MultiValue database development suite.
- Gemini described Shared as an online publisher. Shared sells a white-label operating system for online-ordering businesses.
- Gemini treated Helm Operations as a Kubernetes deployment platform. It sells maritime fleet-management software.
The other five hit commercial facts:
- Towbook was given a $49 monthly starting price instead of the $109 shown on its captured pricing page.
- Later was given a $25 starting price instead of $18.75 per month when billed yearly.
- Ordoro was assigned an unqualified $299 starting price, even though that applied to Dropshipping while Shipping started at $0.
- Ordoro was said to have no free plan, while its Shipping plan was advertised as free.
- Towbook was said to offer a 90-day trial, while its homepage stated 30 days.
We manually checked every automated contradiction against the saved official evidence. Eleven claims were initially flagged. Eight survived review.
The pattern matters more than the error count. Identity collisions damage category positioning. Wrong prices, free plans, and trials change buying decisions.
This is the gap between SEO reporting and revenue reality. A team can celebrate an AI citation while the answer quietly disqualifies the product.
If you only have an hour, audit the fields closest to a buying decision first: company identity, category, starting price, billing basis, free-plan status, trial length, core integrations, and intended customer. These facts change more often than a brand name and matter more than a generic company summary.
Newer Models Traded Abstention for More Assertions
We had an archived run using GPT 5.2 and Gemini 2.5 Flash on the same 100-company sample. Its original scores came from a different judging pass, so we did not compare those scores directly.
Instead, we rescored all 3,923 archived and current search-enabled claims with one blinded Claude Fable 5 judge and the same saved official facts. We then manually reviewed all 20 contradiction flags from that controlled pass.
| Search-enabled cohort | Claims | Verified accuracy | Evidence coverage |
|---|---|---|---|
| GPT 5.2 + Gemini 2.5 Flash | 1,924 | 98.7% | 64.9% |
| GPT 5.5 + Gemini 3 Flash | 1,999 | 99.0% | 55.8% |

Verified accuracy moved by 0.3 percentage points. The behavior change was elsewhere.
The current models produced 224 more substantive assertions and 149 fewer explicit unknowns. They answered more and abstained less. At the same time, the frozen official evidence could settle a smaller share of what they said. Coverage fell by 9.1 points.
More complete answers look better in a demo. They also create more audit surface.
This does not prove the extra assertions were false. It shows that newer endpoints were more willing to continue past the boundary of our evidence.
For technical teams, abstention rate belongs beside accuracy. For marketing teams, answer length and detail are not automatically quality. Anyone who has approved AI-generated campaign copy has already learned this lesson with fewer decimal places.
A Serious Visibility Stack Keeps the Receipts
A single score is excellent for trend lines and executive slides. It is terrible at explaining what to fix.
For each monitored prompt, keep:
- The exact prompt, locale, date, model, and retrieval mode.
- The raw answer, not only the extracted brand mentions.
- Brand presence, position, competitor set, and sentiment.
- Every material product claim as a separate record.
- The source URL reported for each claim, when available.
- The current official evidence quote and URL used for verification.
- A verdict that preserves unresolved claims instead of dropping them.
- The previous claim and source, so drift is visible over time.
If that data model is too heavy for a first pass, start with five columns: prompt, exact claim, reported source, official evidence, and verdict. That is enough to stop an attractive aggregate from hiding a bad commercial fact.
That data model lets a growth lead ask, “Why did our score fall?” and lets an engineer answer without opening five tabs and performing spreadsheet archaeology.
It also changes the action queue. A missed mention calls for distribution or stronger category relevance. A wrong price calls for source correction. An identity collision calls for entity cleanup. Those are different problems wearing the same dashboard color.
What Marketers Can Fix Before the Next Crawl
You do not need to correct the whole internet. Start where buyer risk and your control overlap.
Write one boringly clear entity sentence. Near the top of the homepage, say what the company is, who it serves, and what it does. Keep the clever tagline. Just do not ask it to carry the entire knowledge graph.
Give commercial facts one canonical home. Starting price, billing basis, free-plan status, and trial length should be current, crawlable text. Pricing pages are where clean entity strategies go to die: annual discounts, hidden toggles, region rules, and old help articles all competing for authority.
Clean up stale third-party copies. Search the company name alongside its domain, category, pricing, and trial terms. Review directories, marketplaces, acquired-product pages, old launch posts, and review profiles. The model may be repeating a source the marketing team forgot three rebrands ago.
Monitor buyer prompts, not vanity prompts. Track category, alternative, comparison, pricing, integration, and use-case questions. “What is Acme?” is easier to answer correctly than “Which Acme plan fits a 20-person security team?” The second prompt is closer to revenue.
Open the answer before celebrating the mention. Citation count is a discovery metric. Claim accuracy is a trust metric. You need both. A visibility tracking workflow should retain the prompt, raw answer, sources, evidence, and changes between runs.
This work is less exciting than publishing 50 pages about the future of GEO. It is also more likely to stop a model from quoting last year’s price.
Run This 30-Minute Claim Audit
You can test the claim layer before buying a new platform or asking engineering for a pipeline.
- Choose five buyer prompts. Use one category prompt, one comparison, one pricing question, one integration question, and one use-case question.
- Run each prompt in two answer engines. Use a clean session, save the model name and date, and copy the complete answer.
- Highlight buyer-deciding claims. Mark every statement about category, price, plan, trial, integration, security, target customer, or product capability.
- Check the receipt. Open the reported source, then compare the claim with the current official page. Mark it supported, contradicted, or unresolved.
- Assign the fix. Update an owned page, correct a third-party profile, clarify entity language, or keep the claim on a watchlist for the next run.
Use a plain table. The point is to learn, not to manufacture a sophisticated-looking score.
| Prompt | Exact claim | Reported source | Official evidence | Verdict | Next fix |
|---|---|---|---|---|---|
| Best tools for [use case] | [Copy the sentence] | [URL or none] | [Current URL and quote] | Supported / contradicted / unresolved | Owned / third party / monitor |
Ten answers are enough to reveal whether your immediate problem is presence, sourcing, factual accuracy, or missing official evidence. You will not have a market benchmark. You will have something more useful for the next workday: a ranked repair list.
Methodology for People Who Distrust Benchmarks
Good instinct.
The sample contained 100 B2B software companies with one to 200 employees across the United States, Canada, the United Kingdom, and Australia. Each of four size bands contributed 25 companies.
A company entered the benchmark only when its official site was live, matched the company, and yielded at least four evidence-verified facts. We captured a bounded set of homepage, product, feature, pricing, integration, and about pages. A fact counted only when its official URL and supporting quote matched the captured page text.
Each model received the same dated buyer request containing the company name and domain. It did not receive the evidence profile. We collected one answer per company on July 15, 2026.
We split every answer into claims and assigned one of four verdicts: supported, contradicted, not verifiable, or non-claim. Missing evidence did not count as a contradiction.
A separate model family rescored 563 claims from 20 companies. It agreed with the primary pass on 528 claims, or 93.8%. Human review then reduced the primary run’s 11 automated contradiction flags to eight confirmed errors.
The limits are real:
- One answer per company cannot measure response variance.
- The sample covers smaller B2B software companies in four English-language markets, not the whole software industry.
- Our official-page capture was bounded. Some unresolved claims may have support on pages we did not capture.
- A reported URL does not prove retrieval or reliance.
- Claude Fable 5 lacked equivalent native web retrieval, so it was excluded from the headline search-enabled metrics.
- Commercial-field samples were small. Read the counts before repeating the rate.
The Green Score Is the Start of the Investigation
The 98.6% result is good news. When our evidence could settle a claim, the search-enabled models were usually right.
The 39.5% coverage result is the warning. Six in ten substantive claims sat outside the evidence we could confirm or refute. Some were probably correct. Some exposed missing or conflicting web content. Eight were wrong in ways that could change a buying decision.
AI visibility is not one metric. It is a chain from prompt to mention to claim to evidence to change over time.
If your current stack stops at mentions, keep it. You already have the presence layer. Add a claim review for the five highest-intent prompts before expanding the program. A small audit with visible evidence is more useful than a complete-looking score nobody can interrogate.
Presence gets the brand into the answer. Accuracy keeps the answer worth reading.
The mention is a lead. The claim is the risk. The evidence is the work.